Runtime Analysis
Basics
The AMIDAR concept allows the microinstruction driven processing of byte codes. The microinstruction sequences which are necessary to drive the cicuit are created by the TokenGenerator. Then they are passed to the corresponding functional units which do the actual processing. This allows the step by step processing of any byte code in a mean of round about 3 clock cycles. Nonetheless it is interesting to evaluate different approaches which may increase the runtime even further. The two main approaches which have been made are described in the following passages.
Hardware Based Online Profiling of Byte Code
Profiling the methods of an application can be implemented inside the code memory, since it has to handle access to methods anyway. Thus, it can store the additional profile information together with each profiled method. Also, the code memory knows about each bytecode fetch and each jump. Thus, we can identify all loops in the method and can count the number of bytecodes executed in the different nesting levels of loops. This would be impossible using software profiling, which would only work on the method scope. The following figure shows the hardware circuitry that is required to collect the profile of any method.
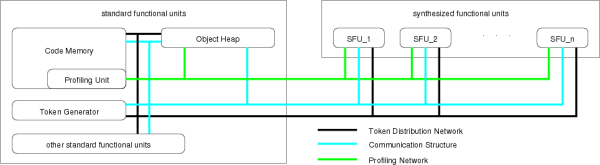
The associative memory (CAM) in the upper left contains the start addresses of all loops. The CAM delivers a Hit signal if the current address matches any of the entries. It also delivers an index associated with this start address. This Index is used to address a second memory which is used to collect and store the profile of the currently executed method. Each entry of this Profile Memory stores the start and end address of one loop, two counter values and a link to the outer loop (Pred), which is the index of the entry describing the loop that surrounds this loop.
Two major events can occur during the execution of a method:
- An inner loop can be entered. This can be recognized with the two signals Hit and SameLoop. The Hit signal occurs if the start of a loop is addressed. The SameLoop signal occurs if the associated loop is the same as the active one (which means, that the same entry of the profile memory stays active). Thus, an innerloop is entered, if the Hit signal is active but the SameLoop signal is inactive.
- A loop is left. This can be recognized by comparing the current address with the end address of the active loop.
The actual counting of executed bytecodes is carried out by the counter Cnt. It is incremented with each fetch of a bytecode from the code memory. To get meaningful results from the profiling it must be possible to get separate values for all levels of nested loops.
A Sample Run
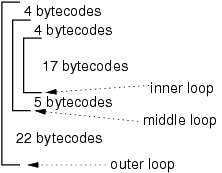
The sample run in the figure below shall illustrate, how the profiling circuit works. It consists of three nested loops. Each iteration of the inner loop takes 17 bytecodes. In the middle loop four bytecodes are executed before entering the inner loop and 5 are executed after the inner loop. In the outer loop four bytecodes are executed before themiddle loop and 22 after the middle loop.
After entering the outer loop Cnt reaches the value
4 before entering the middle loop. This value is stored in
the Local Counter of the outer loop (LCO) and Cnt
is reset to zero. Then Cnt reaches again the value
4 before reaching the inner loop. This time, Cnt is
stored in LCM. Let us assume that the inner loop executes 3
times. Cnt would have a value of 51 when the inner
loop is left. This value must be accumulated to GCI. Then
Cnt would be set to the sum of Cnt and LCM
= 55. If the middle loop would be executed 2 times, then
Cnt would reach 64 before again entering the inner
loop. This value would be stored in LCM and Cnt
would be cleared. Again, the inner loop would account for
51 bytecodes. Leaving the inner loop, this value would be
accumulated to GCI (now being 102). Then, Cnt would be
set to the sum of Cnt and LCM = 115. Before leaving
the middle loop, Cnt would reach the value 120. This
value would be accumulated to GCM and then Cnt would
be increased by the value of LCO.
As can be seen,
the GCI accumulates only the bytecodes of the inner loop,
whereas GCM also accounts for the additional bytecodes of the
middle loop. The same is true for any number nesting levels.
Runtime Profiling of Field Access Operations
The preceding passage shows that it may be usefull to synthesize hardware for single byte code sequences or even whole methods. The runtime acceleration which can be achieved by doing so lies by the factor of ten. Nonetheless it is necessary to take a closer look to the processing of such synthesized byte code sequences. It shows that field access operations which occur in such sequences have to be processed outside of the synthesized functional unit as the necessary information is held by the code memory. This means that the increased communication between the functional units and the corresponded latency will slow down the synthesized hardware structures. In order to reduce this slowdown it may be interesting to cache those objects in hardware which are frequently accessed by the synthesized hardware. This will not only reduce the slowdown effect but speed up the synthesized hardware even more, as all transfers between object heap and the corresponding FU are eliminated.
The First step to evaluate those field access operations is to observe the currently active object for every loaded class in the object heap. All following field access operations related to this object are counted. When another object of the same class is activated, the current objects measurement frame ends and the number of counted accesses can be related to its duration. This speedup statistics can be generated for the whole runtime and all used objects.
Field access operations can be divided in four groups with different runtime.
- single word access operations (swa) - runtime: two clock cycles
- double word access operations (dwa) - runtime: three clock cycles
- single word array access operations (swaa) - runtime: three clock cycles
- double word array access operations (dwaa) - runtime: four clock cycles
This leads to a speedup through caching which can be determined as:
s = cyc/(cyc - 2swa - 3dwa - 3swaa - 4dwaa + totalcosts)
The costs which occur during the use of this caching mechanism depend on the size of the cached objects. Every transfer of one word to the hardware or back, has a latency of one clock cycle. This means an object with four single word fields would take four cycles to be cached.
As only limited storage resources are available for the caching of objects, a decision has to be made which objects should be cached. Such a ranking has to take into account also the hardware costs of the caching (storage elements), since if the caching of two objects has the same speedup, the smaller one makes better use of the storage elements.
The primary criterion for the quality of object caching operations is their efciency. Thus, it is necessary to regard all costs. Thus, the number of projected gained clockcycles of a caching operation is related to the corresponding object size. This fraction then gives information about the number of gained clock cycles per cached object word and is called effciency of a caching operation.
efficiency = gainedcycles/objectsize
Possible candidate objects are sorted by decreasing effciency and as many objects as fit into the storage elements are selected from the start of the list.
A Synthetic Scenario
The displayed graph shows several effects which can occur according to bad predictions on hardware acceleration and continuous or frequent changes of the cached object. Field access operations to two objects of the same class have been evaluated.
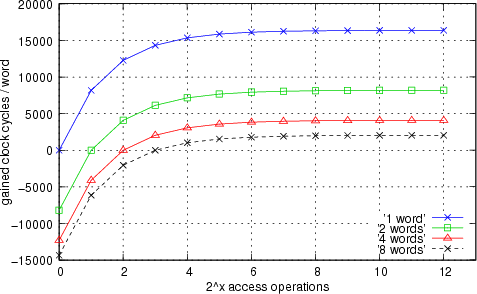
A basic data type Field (32 bit) of both objects was accessed 2^12 times. Each of the four curves displayed in the graph shows the measured data regarding to different object sizes. Every displayed measurement point within a single curve shows the gain through object caching in clock cycles depending on the exchange of the active object every 2^x access operations. It shows that wrong predictions on speedup effects can lead to increasing runtime. At the break even point the runtime costs of a caching operation are compensated by the number of gained clock cycles during the objects caching period.